Silver Market Update: Understanding the Drop and What Comes Next
Silver had been trending higher since early September, forming a steady pattern of higher highs and higher lows. That run carried it up toward the January peak (~$120) before momentum turned sharply. Once the structure broke, selling accelerated quickly, taking silver down into the mid‑70s. The speed of the move reflects how silver typically behaves when liquidity thins and positioning unwinds.
Silver: Recent Trend Break
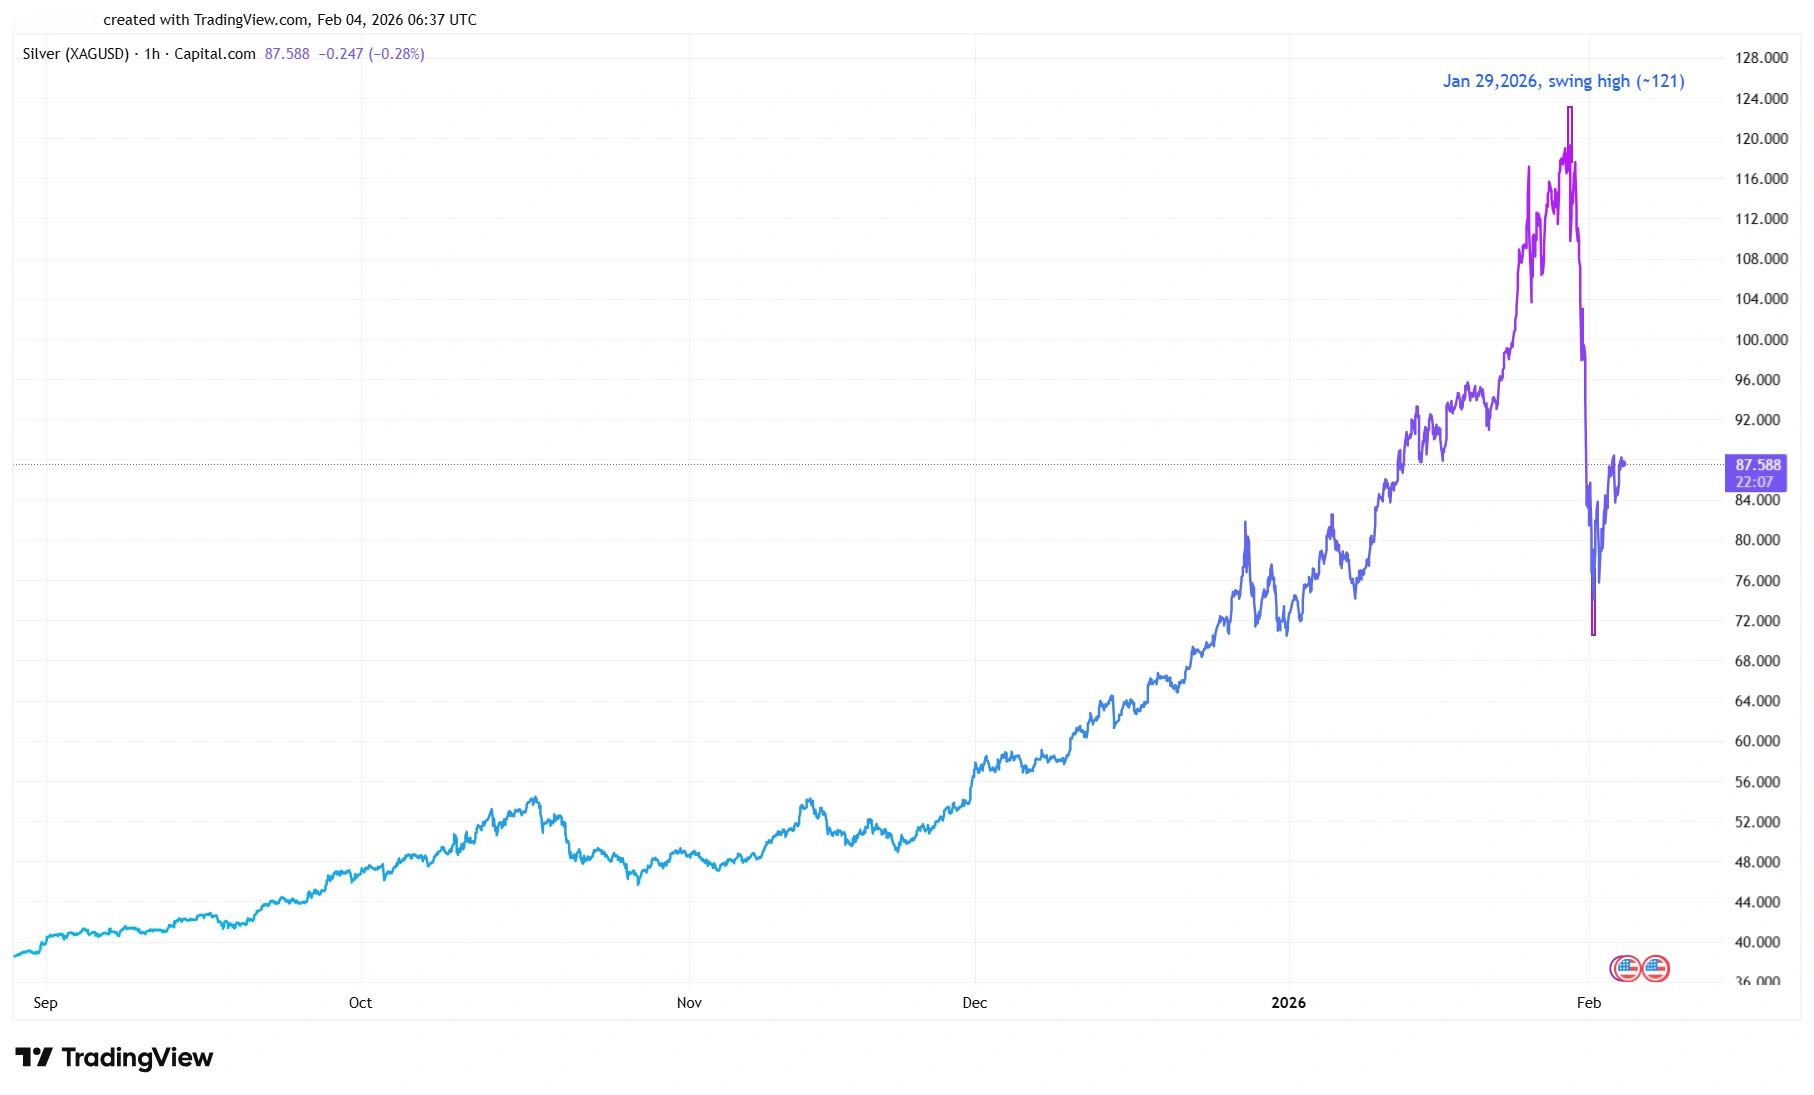
Source: TradingView. Past performance is not a reliable indicator of future performance. Data as of 4 February 2026.
Why Silver Fell So Hard
The decline wasn’t caused by one single factor. It was a combination of sentiment, positioning, and the natural characteristics of the silver market. As the earlier rally extended, long positions became increasingly crowded. When sentiment turned, that meant a lot of traders needed to exit at once. A stronger dollar and tighter margin conditions added pressure, creating a fast and forceful drop in price. And because silver is a smaller and more volatile market than gold, the downside move appeared sharper and more dramatic than what’s typically seen in other precious metals
In other words: the rally went too far, too fast – and then unwound in the same fashion.
Silver’s Sharp Reversal
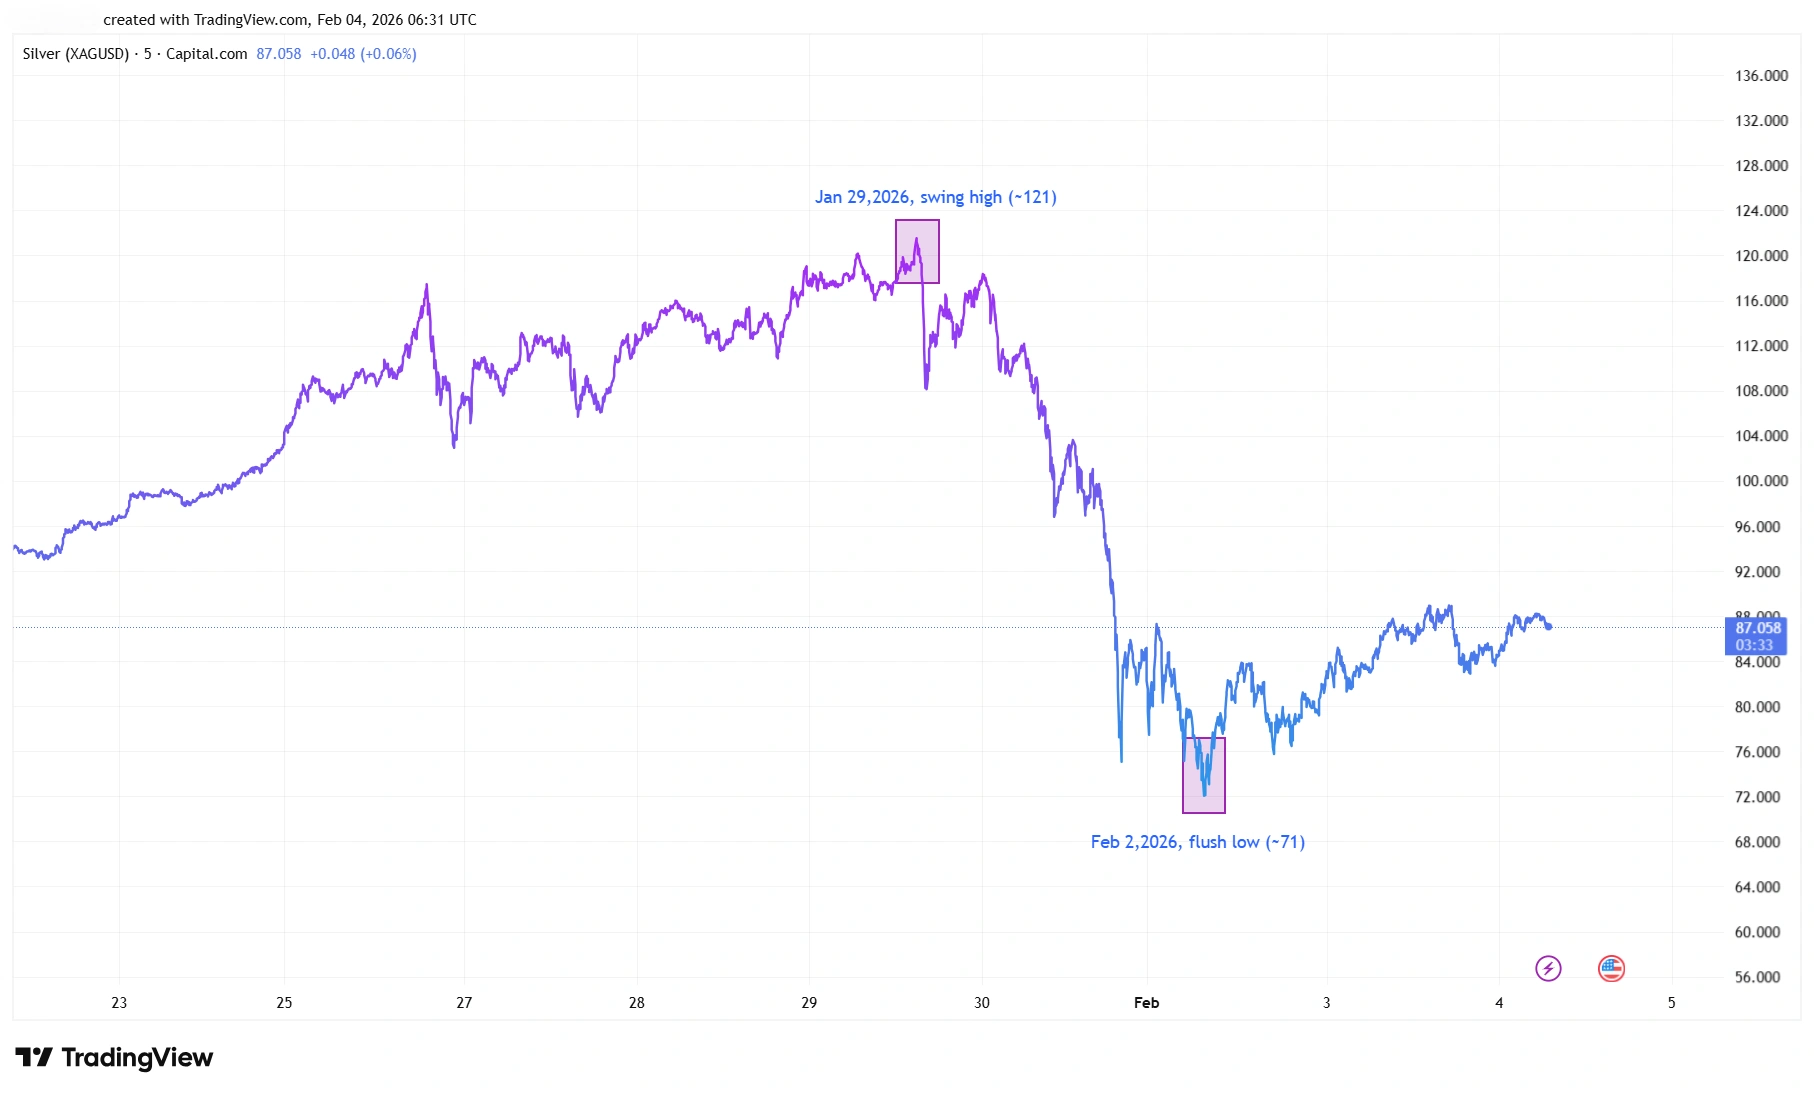
Source: TradingView. Past performance is not a reliable indicator of future performance. Data as of 4 February 2026.
Momentum Indicators: Still Showing Caution
Momentum tools like RSI and MACD give a helpful read on whether the market is stabilizing after the selloff.
Silver: RSI / MACD Snapshot
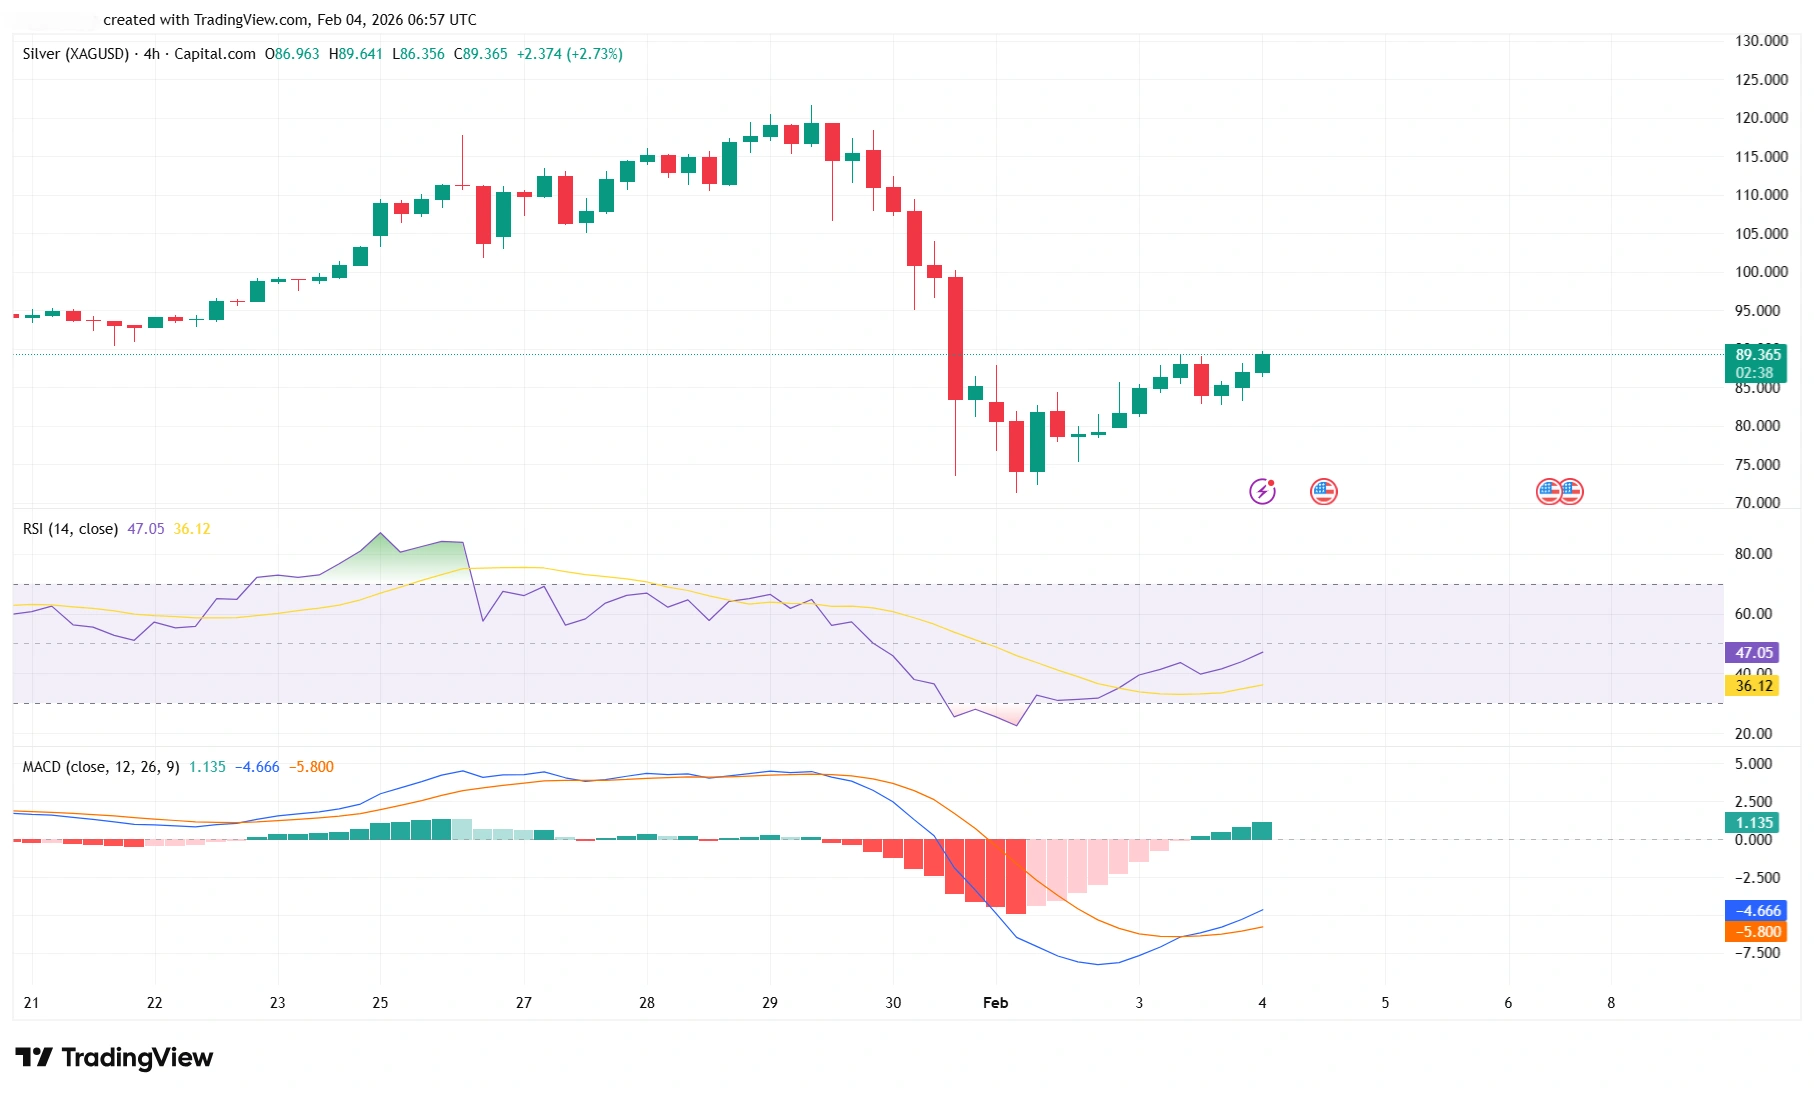
Source: TradingView. Past performance is not a reliable indicator of future performance. Data as of 4 February 2026.
At the moment, RSI remains below 50, which usually signals weak momentum and suggests that any rebounds are still fragile rather than the start of a strong new uptrend. Traders often watch the midpoint level closely because moving back above 50 can indicate buyers are regaining control.
Meanwhile, MACD is still negative, but the histogram bars are shrinking. This is an early sign that downward momentum is fading and that the market may be starting to stabilize after the aggressive selloff. Although this doesn’t confirm a recovery on its own, it does suggest the worst of the selling pressure may be easing. For a healthier trend shift, the MACD line would need to turn upward while the RSI climbs above 50.
Current Market Phase
With the previous uptrend broken, silver is no longer in the same controlled move higher that defined the past few months. Instead, it is now going through a reset phase, where price tries to find balance and build new structure. These periods can include sharp bounces and pullbacks as traders reassess positions and sentiment stabilizes. What matters now is whether silver can form a base strong enough to support a new trend, or whether sellers remain in control on any rallies.
What to Watch Next
The key focus is straightforward: Can silver close back above the level where the trend originally broke? If it can reclaim that area, the current rebound has room to continue and potentially rebuild a positive structure. If price rallies into that zone but fails again, it would signal that sellers are still active, making the recent low near 75 the next major support to monitor.
For now, the market shows early signs of stabilization but hasn’t yet confirmed a full recovery. Patience is important until momentum strengthens and price proves it can hold above key broken levels.